Laravel app monitoring with Laravel Nightwatch
This article is over 12 months old, and may be out of date or no longer relevant.
But you're here anyway, so give it a read see if it still applies to you.
I’ve been using Laravel Nightwatch for a few months now, as part of their early access invitation (yep, that was an exciting message to receive… and found out last week I was either one of the first, or the first external user… thinking aloud here, but Nightwatch swag for that would be awesome 🙃). With Nightwatch releasing to the public soon, I thought I’d share what I’ve found valuable from my time with the platform.
At my day job with Mity Digital, we’ve set up Nightwatch to run on a number of different project types including stock-standard Statamic sites, one which has a Laravel app baked in, as well as Inertia-based Laravel apps: and it has been great to see how we’re able to use Nightwatch for different scenarios, app types and setups, including multiple environments like staging vs production.
During this time, I’ve seen the product evolve, and help shape some of the features as the Nightwatch team get an understanding of how others in the ecosystem use the data it collects (and what data gets collected by packages like Statamic). I’ve been bombarding them with feature requests and ideas – and it’s great to see some of them available already and also hear whispers that some of my other requests will likely come with time.
The setup process
Setting up a new app in Nightwatch is incredibly easy.
From within Nightwatch, you need to create a new app – and can customise with different environment colours and an optional app icon.
Nightwatch presents you with the steps to follow:
Install the Nightwatch package (and you can click the button to copy the command)
Add the Nightwatch token to your
.envfile (again, copy and paste), andOptionally update your
.envfor logging configuration if you want these in Nightwatch.
On your server, then set up a daemon to run the Nightwatch agent. And no doubt there’ll be a one-flick toggle in Forge at some point like there is for the scheduler and Horizon.
When the agent is talking to Nightwatch, you’re all set up and ready to go. Adding Nightwatch to an app takes minutes: really easy and friction free.
During testing, I have also had multiple Nightwatch agents for different apps running on the one server: the docs now include the necessary command line parameter to do this. Super easy.
Within Nightwatch
What I find most appealing – as a Laravel developer – is that it is clearly made for Laravel developers. I’ve looked at other tools in the past but they employed their own terminology: but in Nightwatch, it is incredibly easy to get started and understand what you’re looking at because it all refers back to what you use while building the app – there’s requests, routes, jobs, commands, scheduled tasks, notifications, mail, and the list goes on.
Browsing requests is incredibly fascinating to see the lifecycle of each request, and has been so curiously invaluable at highlighting where parts of the app could be improved or changed to increase performance and help debug otherwise odd issues.
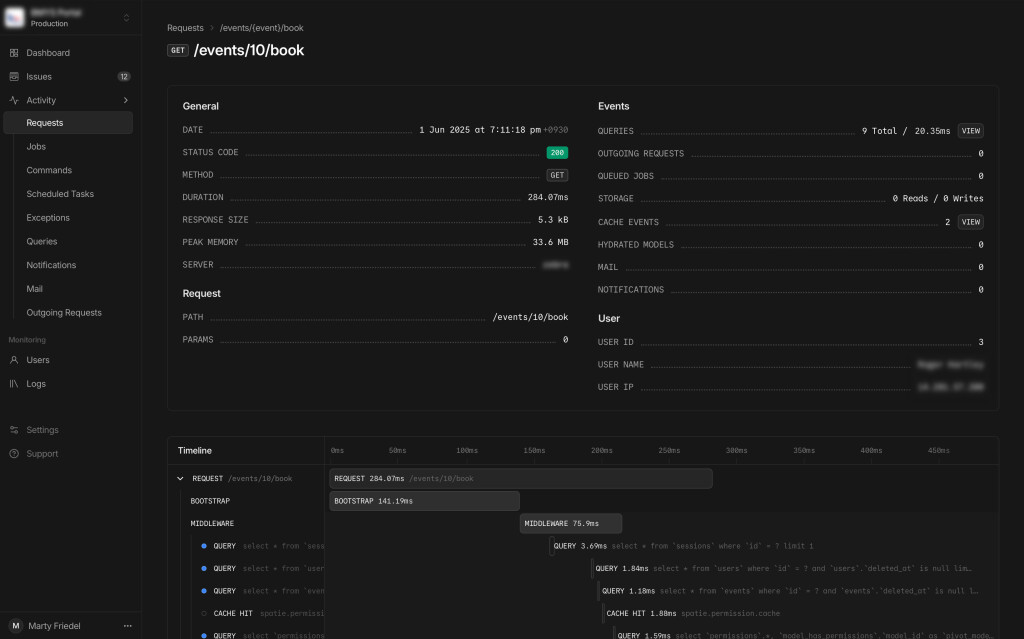
This was really interesting for two of our Statamic sites that would have images suddenly stop being handled. Using Nightwatch, we were able to identify some behaviours within the way Statamic’s stache is operating that highlighted odd behaviour: which was passed over to the Statamic team. Because, of course and as always, these issues were not repeatable on every request. But having trails of different requests that work on one request, but fail on another, provided valuable and meaningful data to allow for easier debugging.
While we may have so much faith in our app and test suite, of course when running with real users and real data, things can not always go to plan. This is where Nightwatch has been most valuable: to see what has happened in the past, but still keep it in context for Laravel-speak. I don’t need to learn the APM tool itself to understand the data being presented.
Being able to click through on basically every interface to dig deeper in to different parts of the request, app or summary makes it incredibly easy to digest and evolve your view. And its summary views are great for highlighting where a route may be taking longer than others, giving you an easy way to spot outliers to start exploring what exactly is happening with your app.
When things do go wrong, the Issues view shows and groups exceptions: meaning that if the same issue keeps happening, you’re not bombarded with a list of the same issue, but the Issue view provides the exception, recent occurrences, first and last seen, and the ability to assign to members of your team and comment on the issue in a central place.
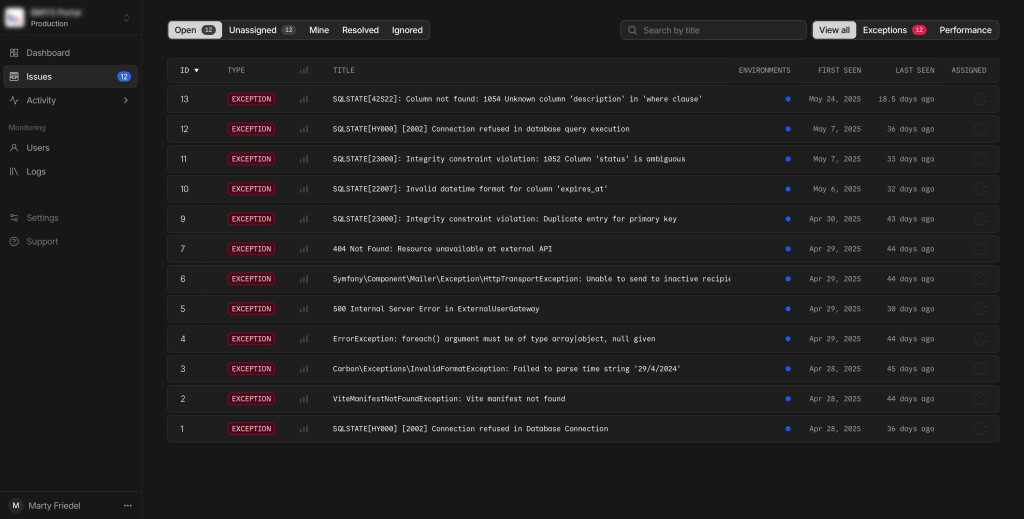
This has been really useful to have such a detailed yet noise-free view of exceptions that have been thrown. And, of course, from within the Issue, you can dig deeper to the occurrences and then explore those individually too.
Quotas and plans
During the testing process, I have had unlimited quotas: so have collected so much data. In the final stages, quotas were enabled which quickly showed just how noisy apps can be: particularly Statamic.
One of our really busy Statamic sites used up, well, all of our free plan quota in a matter of hours. This is due to the way that Statamic works with the cache for its stache: so lots of requests equals lots of cache hits which means lots of chatter going to Nightwatch, which means your events get used up quickly.
Going through the setup process again as I write this, there’s a new step in the process and that is suggesting to use sampling of incoming data to get your app up and running and then adjust your sample rate from there based on your app, its behaviour and your needs.
All of the plans - including the free plan - are event based. Anything that gets sent to Nightwatch, a cache hit, an exception - is an event. And your plan is governed by a number of events that you can scale to meet your app’s needs. Each Organisation within Nightwatch can also have its own subscription too - useful if there’s a need to separate the billing for different Organisations.
I have discussed this a bit further with the Nightwatch team, and made a feature request which I believe is being worked on, but not ready yet. Will share more on that when it comes. This feature would make it feel like a better fit for Statamic and its stache, so am looking forward to testing it when it becomes available.
What I’d like to see
One thing missing from the platform, especially relevant (or meaningful) for the Inertia world that use a JS frontend, is that issues that occur client side are not tracked. At this stage. At the recent PHPxADL meetup, Jess Archer spoke about this and the Nightwatch team are obviously aware of this (and its importance) but also want to find the right way to have these events reported in an equally as meaningful way that they’ve done with the core Laravel-aspect of the platform.
And the other one: request payloads. If a POST/PUT comes to the server, it would be really useful to see the payload. But I do appreciate that storing that payload comes with additional considerations for the Nightwatch team, so I do know it is being discussed, but no solid outcome yet.
Over the past few weeks, the platform has evolved: new things have been added, fixed, changed, revised, and I do truly believe that there is so much more to come.
My thoughts
I’m a Laravel developer. Sure, I write Vue, Alpine, Livewire. But I am a Laravel developer. And that is where Nightwatch slots in so beautifully.
It’s just speaking the same language, making it a great fit for other Laravel developers.
For a Laravel app, it’s a no-brainer. It offers so much visibility to your app that helps make your long-term support role so much easier.
For a Statamic site, depending on the site’s load and configuration, maybe not yet given how many events a single request could send to Nightwatch. The already-available sampling is one potential solution (but then only seeing part of the requests), and the other feature I eluded to before would be much more useful. I believe it’ll come, but right now, Statamic sets a lot of events to Nightwatch so watch your quotas.
For Mity Digital, we’ve found Nightwatch to be incredibly valuable at gaining understanding of what sites and apps are doing when they have varying user loads and inbound data: what is swift, what slows down, what rouge exception did we miss during testing.
As Nightwatch gets ready to launch publicly, I’ve suggested to Mity Digital (so me and Michael) that we keep Nightwatch in our toolkit to help inform us of our apps, monitor their performance and behaviour, and provide a better quality service to our clients.
And for what it’s worth, everything here is my own voice and ideas. I’m not being paid to say these things
Comments
Reply on Bluesky to join the conversation.